14. Trending in Studio 5000: A Powerful Troubleshooting Tool
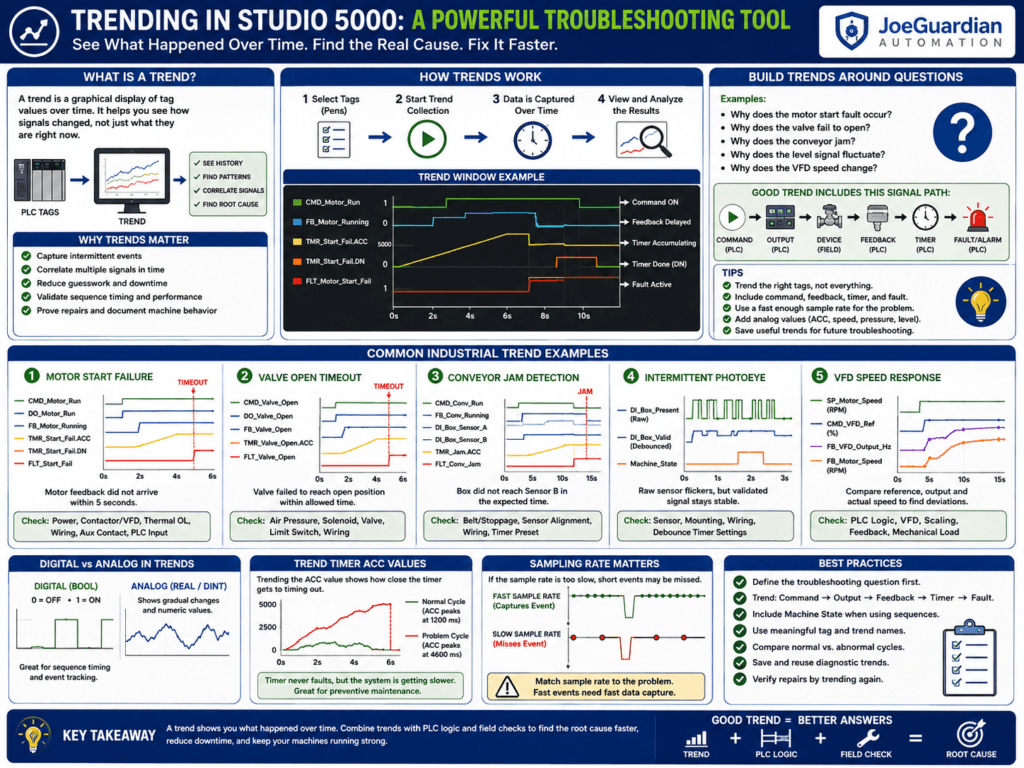
One of the biggest challenges in industrial troubleshooting is dealing with problems that happen too fast to observe.
A sensor may turn off for only 100 milliseconds. A motor feedback signal may arrive late. A valve may occasionally take longer than normal to open. A VFD speed reference may suddenly drop. A sequence may skip a state for only a fraction of a second.
When you are online with Studio 5000, you can watch tags change in real time.
But sometimes watching individual tags is not enough.
This is where Trends become extremely useful.
A Trend lets you record and visualize PLC tag values over time.
Instead of asking:
What is the value right now?you can ask:
What happened over the last several seconds or minutes?For an automation technician, this can completely change how an intermittent problem is diagnosed.
What Is a Trend in Studio 5000?
A Trend is a graphical tool that displays tag values over time.
You select one or more tags, start the trend, and Studio 5000 plots the values as the controller runs.
Conceptually:
PLC Tags
   ↓
Trend
   ↓
Time-Based Graph
A trend lets you see relationships between signals.
For example:
CMD_Motor_Run
FB_Motor_Running
TMR_Motor_Start_Fail.ACC
FLT_Motor_Start_Fail
Instead of looking at these tags individually, you can see when each one changed relative to the others.
That timing relationship is often the key to finding the real problem.
Why Trends Matter to Technicians
Imagine a machine operator reports:
The conveyor stops randomly, but when maintenance arrives everything looks normal.
This is a classic intermittent fault.
If you simply monitor the ladder logic, you may never catch the event.
A trend can help you capture signals such as:
CMD_Conveyor_Run
FB_Conveyor_Running
DI_Box_Present
DI_Motor_OL_OK
FLT_Conveyor_Jam
Then, when the problem occurs, you can look back at the signal history.
You may discover:
Command = ON
↓
Motor Feedback = OFF for 600 ms
↓
Jam Timer begins timing
↓
Feedback returns
or perhaps:
Box sensor flickers OFF
↓
Sequence changes state
↓
Conveyor stops
Now you have evidence instead of guessing.
Trend vs Watching Tags Online
Watching tags online gives you a snapshot.
A trend gives you history.
Watching Tags
You see:
FB_Motor_Running = 1That tells you the current condition.
But it does not tell you whether the feedback dropped out one second ago.
Using a Trend
You may see:
Time       FB_Motor_Running

10.0 s     1
10.2 s     1
10.4 s     0
10.6 s     0
10.8 s     1
Now you know the signal dropped for approximately 400 ms.
That can point toward:
- loose wiring
- failing auxiliary contact
- unstable network connection
- sensor vibration
- noisy input
- intermittent VFD feedback
This is why trends are so valuable.
Where Trends Appear in Studio 5000
Inside the Controller Organizer, you may see a section for:
TrendsYou can create a trend and add tags to it.
A typical troubleshooting trend might include several related signals.
For example:
Motor_Start_Trendwith:
CMD_Motor_Run
DO_Motor_Run
FB_Motor_Running
TMR_Motor_Start_Fail.ACC
TMR_Motor_Start_Fail.DN
FLT_Motor_Start_Fail
The important idea is not simply to trend many tags.
The goal is to trend the right tags.
Think in Signal Chains
A powerful way to build troubleshooting trends is to follow the same signal path we use throughout this series:
Field Device
↓
I/O Module
↓
Tag
↓
Logic
↓
Output
↓
Field Device
↓
Feedback
For troubleshooting, your trend should follow that path whenever possible.
Example:
CMD_Valve_Open
DO_Valve_Open
FB_Valve_Open
TMR_Valve_Open_Timeout.ACC
TMR_Valve_Open_Timeout.DN
FLT_Valve_Failed_To_Open
Now you can see the complete sequence.
Industrial Example 1 — Motor Start Failure
Suppose a motor occasionally generates:
FLT_Motor_Start_FailThe fault logic might be:
CMD_Motor_Run
AND
NOT FB_Motor_Running
↓
TON TMR_Motor_Start_Fail
PRE = 5000
Instead of only watching the fault bit, create a trend with:
CMD_Motor_Run
DO_Motor_Run
FB_Motor_Running
TMR_Motor_Start_Fail.ACC
TMR_Motor_Start_Fail.DN
FLT_Motor_Start_Fail
A normal start may look like:
0.0 sec   CMD = ON
0.1 sec   DO = ON
1.2 sec   FB = ON
1.2 sec   Timer resets
Everything is good.
But a failed start may look like:
0.0 sec   CMD = ON
0.1 sec   DO = ON
5.0 sec   FB still OFF
5.0 sec   Timer.DN = ON
5.0 sec   Fault = ON
Now the problem is much clearer.
Industrial Example 2 — Slow Valve
Suppose a pneumatic valve usually opens in 1.5 seconds.
One day operators report intermittent valve timeout alarms.
Trend:
CMD_Valve_Open
DO_Valve_Open
FB_Valve_Open
TMR_Valve_Open_Timeout.ACC
FLT_Valve_Failed_To_Open
You might discover:
Normal Cycle:
Valve feedback = 1.4 sec

Problem Cycle:
Valve feedback = 3.8 sec

Timeout preset = 4.0 sec
The valve is technically still opening before the timeout, but it is getting dangerously close.
This may indicate:
- low air pressure
- sticky actuator
- mechanical wear
- damaged tubing
- dirty solenoid
- process buildup
The trend can reveal a deteriorating condition before the valve completely fails.
Industrial Example 3 — Intermittent Photoeye
Suppose boxes occasionally stop incorrectly on a conveyor.
You suspect:
DI_Box_PresentTrend:
DI_Box_Present
DI_Box_Present_Valid
CMD_Conveyor_Run
Machine_State
FLT_Conveyor_Jam
You may observe:
Raw sensor:
1 → 0 → 1
within 100 milliseconds.
But the debounced signal remains:
DI_Box_Present_Valid = 1That confirms the debounce logic is working.
Or you may discover the validated signal is also dropping.
Then you know the issue is more significant.
Industrial Example 4 — VFD Speed Reference
Trends are especially useful with analog values.
Suppose a motor speed changes unexpectedly.
You might trend:
SP_Motor_Speed_RPM
CMD_VFD_Speed_Reference
FB_VFD_Output_Hz
FB_Motor_Speed_RPM
A healthy system might show:
Speed SP
↓
VFD Reference
↓
Output Frequency
↓
Motor Feedback
all following each other smoothly.
If the speed setpoint stays stable but the VFD reference drops, then the problem is probably inside the PLC logic.
If the reference stays stable but the actual frequency changes unexpectedly, investigate the drive.
This narrows the troubleshooting area dramatically.
Industrial Example 5 — Analog Process Value
Suppose a tank level appears unstable on the HMI.
Trend:
AI_Tank_Level_Raw
PV_Tank_Level_Percent
SP_Tank_Level
CMD_Fill_Valve
You might discover:
Raw Signal = Stable
Scaled PV = Unstable
That suggests a programming or scaling issue.
Or:
Raw Signal = Unstable
Scaled PV = Unstable
Then the problem is probably closer to:
Sensor
Wiring
Analog Module
Grounding
Electrical Noise
Again, the trend helps separate field problems from logic problems.
Industrial Example 6 — Machine State Sequence
Trends are excellent for state machines.
Suppose your sequence uses:
Machine_Statewith values such as:
0  = Idle
10 = Start
20 = Filling
30 = Mixing
40 = Discharge
50 = Complete
90 = Fault
Trend:
Machine_State
CMD_Fill_Valve
FB_Fill_Valve_Open
PV_Tank_Level
FLT_Process
You may discover:
0
↓
10
↓
20
↓
90
The machine went directly from filling to fault.
Now you can correlate that state change with the other signals.
Perhaps:
FB_Fill_Valve_Open = 0at exactly the same time.
That is far easier to understand on a trend than by watching dozens of rungs.
Digital vs Analog Tags in Trends
Trends can display both digital and analog information.
Digital Tags
Examples:
BOOLSuch as:
CMD_Motor_Run
FB_Motor_Running
FLT_Motor_OL
DI_Box_Present
Digital signals typically switch between:
0
1
They are useful for checking sequence timing.
Analog Tags
Examples:
REAL
DINT
Such as:
PV_Tank_Level
SP_Motor_Speed
AI_Pressure_PSI
TMR_Start_Delay.ACC
Machine_State
These can show gradual or numerical changes.
Trend Timer ACC Values
One of my favorite troubleshooting techniques is trending a timer’s .ACC value.
For example:
TMR_Motor_Start_Fail.ACCInstead of only seeing whether the timer is done, you can observe how close it gets to the timeout.
Imagine:
PRE = 5000Normal start:
ACC reaches approximately 1200 msProblem cycle:
ACC reaches approximately 4600 msTechnically the timer never faults.
But something is clearly becoming slower.
That is valuable maintenance information.
Comparing Command and Feedback
One of the most useful trend patterns is:
Command
Feedback
Examples:
CMD_Motor_Run
FB_Motor_Running
CMD_Valve_Open
FB_Valve_OpenCMD_Conveyor_Run
FB_Conveyor_RunningThe difference in time between command and feedback tells you the response time of the device.
Conceptually:
CMD ON
|---------------------------->
FB ON
|--------------------->The delay between them is the device response time.
If that delay starts increasing, you may have a developing mechanical or electrical problem.
Add the Fault to the Trend
When troubleshooting a machine fault, do not only trend the suspected signal.
Include the actual fault.
Example:
CMD_Motor_Run
FB_Motor_Running
TMR_Motor_Start_Fail.ACC
FLT_Motor_Start_FailThis lets you see exactly what happened immediately before the fault.
The fault becomes a reference point in time.
Add the Machine State
If the PLC uses a state machine, add:
Machine_Stateto the trend.
This can be extremely useful.
You may see:
State 20
↓
Sensor turns ON
↓
State 30
↓
Valve command turns ON
↓
Valve feedback missing
↓
State 90Now the entire sequence can be reconstructed.
Do Not Trend Everything
A common mistake is adding too many tags.
You may think:
More information is better.
But if you add 50 unrelated tags, the trend becomes difficult to interpret.
A better approach is to define the troubleshooting question first.
Example:
Why is the motor start failure occurring?Then select only the related tags.
Perhaps:
CMD_Motor_Run
DO_Motor_Run
FB_Motor_Running
DI_Motor_OL_OK
FB_VFD_Ready
TMR_Motor_Start_Fail.ACC
FLT_Motor_Start_FailNow every tag has a purpose.
Create Trends Around Questions
A good technician trend should answer a specific question.
Examples:
Why does the valve fail to open?Why does the conveyor jam fault occur?Why does the VFD speed reference change?Why does the sensor occasionally disappear?Why does the machine skip a sequence step?This mindset keeps the trend focused.
Trend the Source and Destination
Remember our previous discussion about MOV instructions.
Suppose an HMI speed setpoint unexpectedly changes.
Trend:
HMI_Speed_SP
SP_Motor_Speed_Working
CMD_VFD_Speed_ReferenceIf:
HMI_Speed_SP = stablebut:
SP_Motor_Speed_Working = changingthen some PLC instruction may be overwriting the working value.
You can then search for instructions writing to that tag.
The trend tells you when the value changes.
The ladder logic tells you why.
Trends and Intermittent Network Problems
A trend can also help identify communication-related behavior.
For example:
FB_Remote_IO_Healthy
FB_VFD_Comm_OK
FB_Motor_Running
CMD_Motor_RunIf multiple remote signals drop simultaneously, you may suspect:
Network
Remote I/O Adapter
EtherNet/IP Connection
Switch
Cable
Powerinstead of three different field devices failing at exactly the same moment.
Patterns matter.
Trends and Analog Noise
Analog signals are another excellent use case.
Imagine pressure should remain near:
60 PSIbut the operator reports that it jumps occasionally.
A trend may reveal:
60.1
60.2
59.9
60.0
84.5
60.1That single spike might be difficult to see by watching the live tag.
Possible causes include:
- wiring interference
- poor shielding
- bad grounding
- loose terminal
- transmitter problem
- analog input module issue
Sample Rate Matters
A trend can only show events that it actually captures.
If the trend updates slowly, a very short event may happen between samples.
Example:
Signal dropout = 50 msIf your trend only captures a new point every:
500 msyou may miss it entirely.
This is an important troubleshooting concept:
Fast problem
=
Need sufficiently fast data captureDo not automatically assume that a flat trend means nothing happened.
The trend resolution must match the problem you are trying to observe.
Technician Troubleshooting Example
Imagine an operator tells you:
Sometimes the filler stops and gives a valve-open fault.
Instead of immediately replacing the valve sensor, create a focused trend.
Use:
CMD_Fill_Valve_Open
DO_Fill_Valve_Open
FB_Fill_Valve_Open
TMR_Fill_Valve_Open.ACC
TMR_Fill_Valve_Open.DN
FLT_Fill_Valve_Open
Machine_StateThen run the machine.
A failed cycle may reveal:
CMD = ON
↓
DO = ON
↓
Timer starts
↓
Feedback arrives at 3900 ms
↓
PRE = 4000 msThe valve barely makes the timeout.
The actual issue may be a slow valve rather than a PLC problem.
That is much better evidence than simply resetting the alarm.
Programmer Perspective
From a programmer’s point of view, trends help validate the design.
During commissioning, you can verify:
- sequence timing
- sensor order
- motor start delays
- valve response times
- state transitions
- analog scaling
- PID-related values
- machine cycle timing
- alarm delays
For example:
CMD_Valve_Open
FB_Valve_Opencan help determine a realistic timeout value.
Instead of guessing:
Valve timeout = 3 secondsyou can collect actual data.
If normal opening time is:
1.1 to 1.4 secondsthen you can choose a timeout based on real machine behavior.
Commissioning with Trends
Trends are not only troubleshooting tools.
They are also commissioning tools.
During startup of a new system, create trends for critical devices.
For example:
CMD_Pump_Run
FB_Pump_Running
AI_Flow_GPM
PV_Tank_Level
CMD_Control_Valve
You can verify the sequence behaves as expected.
This helps catch problems before production begins.
Naming Your Trends
Use meaningful names.
Bad examples:
Trend1
NewTrend
Test
Better examples:
Motor_Start_Troubleshooting
Valve_Open_Timeout
Conveyor_Jam_Diagnostic
Tank_Level_Analysis
VFD_Speed_Response
Machine_Sequence_Startup
A clear name helps the next technician understand why the trend exists.
Build Reusable Diagnostic Trends
For important machines, you can keep useful diagnostic trends in the project.
Examples:
Motor_Diagnostics
Valve_Diagnostics
Sequence_Diagnostics
Analog_Process_Trend
VFD_Diagnostics
This can save troubleshooting time later.
Instead of rebuilding the same trend every time a machine fails, technicians can open an existing one.
A Practical Trend Strategy
When troubleshooting, try this structure:
1. Command
2. Output
3. Feedback
4. Timer
5. Fault
6. Machine State
For a motor:
CMD_Motor_Run
DO_Motor_Run
FB_Motor_Running
TMR_Motor_Start_Fail.ACC
FLT_Motor_Start_Fail
Machine_State
For a valve:
CMD_Valve_Open
DO_Valve_Open
FB_Valve_Open
TMR_Valve_Open_Timeout.ACC
FLT_Valve_Open
Machine_State
This creates a very powerful diagnostic picture.
Troubleshooting Workflow Using Trends
A practical workflow is:
1. Identify the reported problem.

2. Find the related PLC logic.

3. Determine the command signal.

4. Determine the expected feedback.

5. Identify any related timer.

6. Identify the fault or alarm.

7. Add those tags to a trend.

8. Run or monitor the machine.

9. Capture the failure.

10. Compare command, feedback, timer, and fault timing.

11. Trace the abnormal signal back toward the field.

12. Correct the root cause.

13. Run the machine again.

14. Compare the new trend to the failed cycle.
That last step is important.
A trend can also help prove that the repair actually fixed the problem.
Trend Before and After a Repair
Imagine a valve takes:
3.7 secondsto open before repair.
After cleaning the actuator and replacing damaged tubing:
1.3 secondsNow you have measurable evidence that the repair improved device performance.
This is excellent information for:
- maintenance records
- work orders
- troubleshooting reports
- reliability analysis
Common Trend Mistakes
1. Trending Too Many Tags
Focus on the system involved in the problem.
2. Forgetting the Command
Without the command, it may be difficult to determine when the sequence started.
3. Forgetting Feedback
Without feedback, you cannot compare command versus actual device response.
4. Forgetting the Fault
The fault provides a useful reference point.
5. Using Only Digital Signals
Sometimes an analog value such as:
ACC
Pressure
Speed
Current
Level
reveals more than a BOOL signal.
6. Ignoring Sample Rate
Short events can be missed if the trend captures data too slowly.
7. Treating the Trend as the Root Cause
A trend shows behavior.
You still need to interpret the behavior and verify the physical system.
Trend + Ladder Logic = Powerful Combination
A Trend tells you:
WHEN something happened.Ladder logic tells you:
WHY the PLC reacted.The field inspection tells you:
WHY the physical signal changed.Together:
Trend
+
PLC Logic
+
Field Troubleshooting
=
Root Cause
That is the real value of using trends.
Technician Mindset
When an intermittent fault occurs, do not ask only:
What is wrong right now?Also ask:
What happened immediately before the fault?That is exactly what a trend helps you investigate.
Key Terms
Trend = Graphical history of PLC tag values

Pen = A tag or signal displayed in a trend

Sample Rate = How frequently data is captured

Digital Signal = Typically a BOOL value such as 0 or 1

Analog Signal = Numerical value such as pressure, speed, level, or temperature

Command = PLC instruction requesting an action

Feedback = Confirmation that the device responded

Intermittent Fault = Problem that appears and disappears

Sequence = Ordered machine operation or state progression
Final Thoughts
Studio 5000 Trends are one of the most valuable troubleshooting tools available to an automation technician.
They allow you to move beyond:
What is the PLC doing now?and investigate:
What actually happened before the machine failed?A well-designed trend can expose:
- slow motor feedback
- sticking valves
- intermittent sensors
- VFD reference changes
- analog noise
- sequence problems
- timer behavior
- communication dropouts
The key is to trend signals that belong together.
Use the same industrial thinking we have developed throughout this series:
Command
↓
Output
↓
Device
↓
Feedback
↓
Timer
↓
Fault
Once you can visualize those signals over time, troubleshooting becomes much more logical.
Instead of guessing, you are reconstructing the machine event.
And that is one of the biggest differences between simply watching PLC logic and truly diagnosing a control system.